Compressed Air & Leakage Monitoring
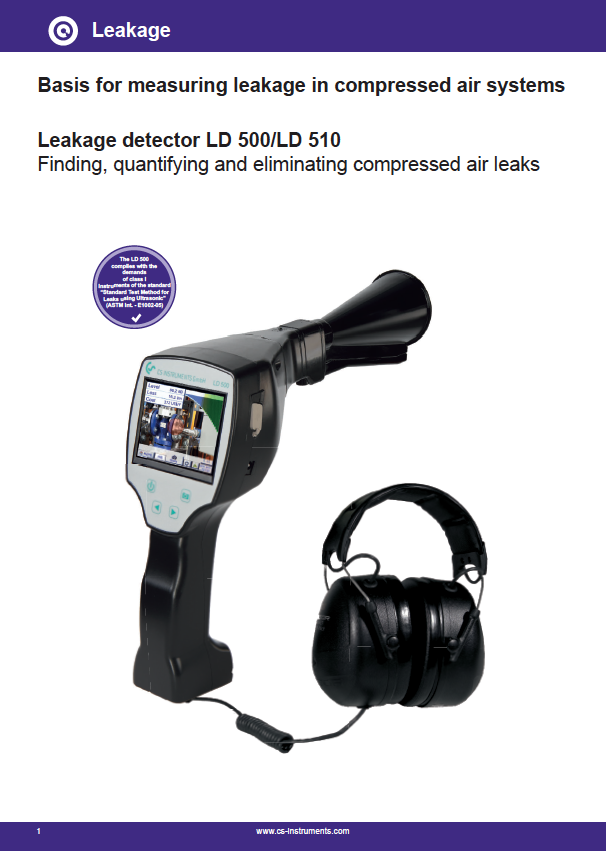
Finding, quantifying and eliminating compressed air leaks
Compressed air is one of the most expensive forms of energy. It is produced by compressing ambient air with a compressor. Impurities in the compressed air can cause higher waste if they come into contact with the end product.
The quality of the compressed air produced can cause production issues and as a result, have an impact on operating costs. This is why compressed air is required to be treated after it is generated to remove water, oil, dust particles and other impurities to improve the quality and thus, avoid these issues.
The compressed air system must be designed to produce the correct quantity and quality of air as well as achieving maximum efficiency to avoid additional costs. The greatest savings potential is achieved by locating and repairing leaks in the system to ensure this efficiency is met.
Identifying leaks in compressed air systems are not as easily as detectable water systems, for example. It is recommended that you perform a leakage location on a regular basis in order to find and fix leaks in order to save you money.
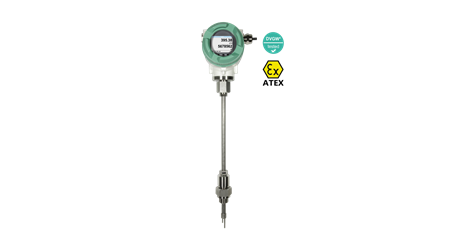
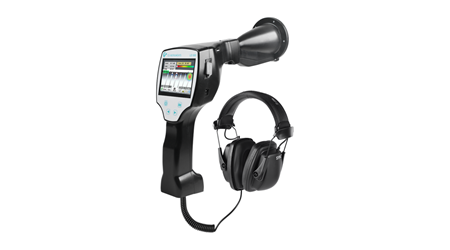
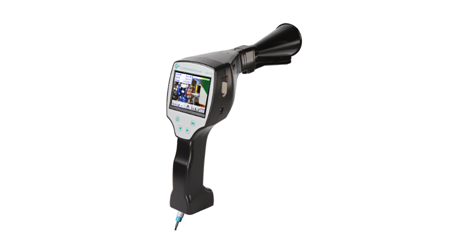
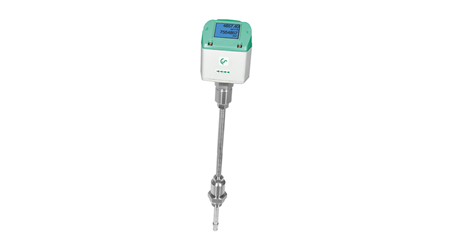
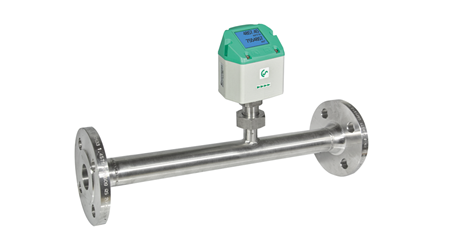
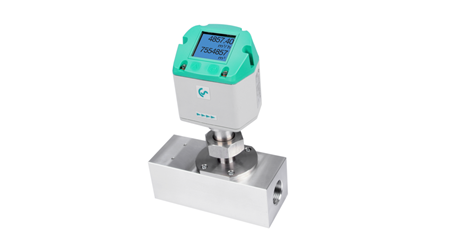
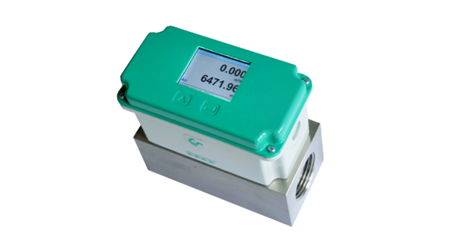
A variety of instruments are used for leak detection. The most common instruments used for this task include portable acoustic devices that can detect air leaks through sound, and sensitive inline flow meters which will give totalisation when there should be none!
View the range >>
Which compressed air flow meter should be used at which point?
Learn more in CS Instruments Basis for measuring leakage in compressed air systems research article.
Leak Detection Applications
Reduction of energy costs and CO2 emissions through the combination of flow measurement and leakage detection in compressed air
Example 1: A pharmaceutical company
High compressed air leakage rates and incorrectly sized components (compressors and compressed air receivers) reduce the efficiency of your compressed air system and generate unnecessary CO2 emissions and reduce competitiveness. How much compressed air a production requires over a week and how components need to be sized so that they run as efficiently as possible and are utilized to their capacity, can be measured with a compressed air flow meter. In the graph shown, you can see the volume flow profile measured behind the compressed air tank of a pharmaceutical company for about 10 days. The green curve corresponds to the actual measured volume flow profile (moving average) and the red curve corresponds to the volume flow profile after the "simulated" leakage elimination. As you can see, the entire curve shifts downward.
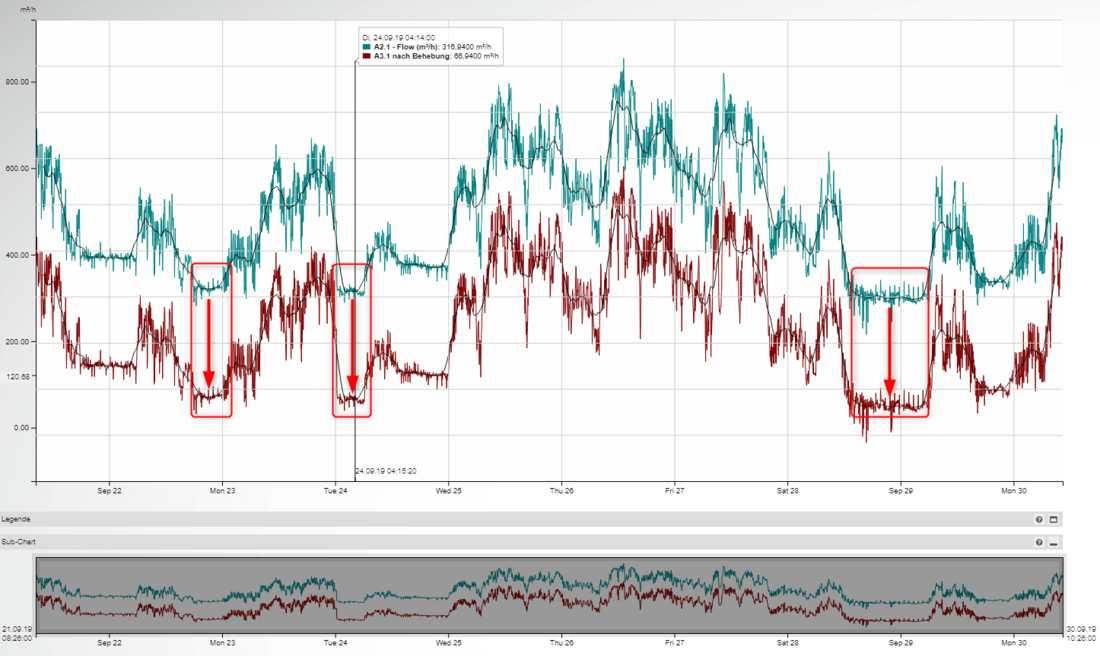
During the times marked in red, production was at standstill and did not produce any goods - i.e., at that time compressed air escaped solely via leakages and open nozzles.
This value should always be as low as possible and should decrease after leakages have been eliminated.
In the graph shown, the following improvements are based on the following assumptions:
- Specific power: 20,388 kW / 100 cfm
- Electricity price: 10 €Cent / kWh
- Running time: 8000 h/ year
- CO2 emissions electricity mix domestic consumption: 0,837 pound / kWh
Example 2: A bakery business
The following graph shows the volume flow profile of a bakery:
- The bakery consists of 2 production halls.
- Hall 1 (older equipment) is shut down temporarily
- In hall 2 production starts at 10:00 am
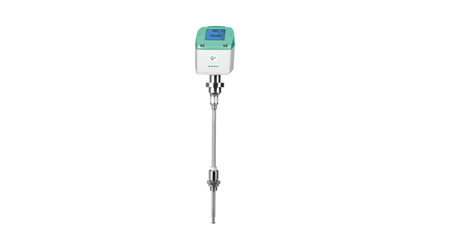
A VA 500 (thermal flow sensor) was installed behind the compressed air tank to measure the consumption of the two halls.
In the original volume flow profile (light green) you can see the compressor switching on and off. Therefore, the moving average was calculated additionally (dark green).
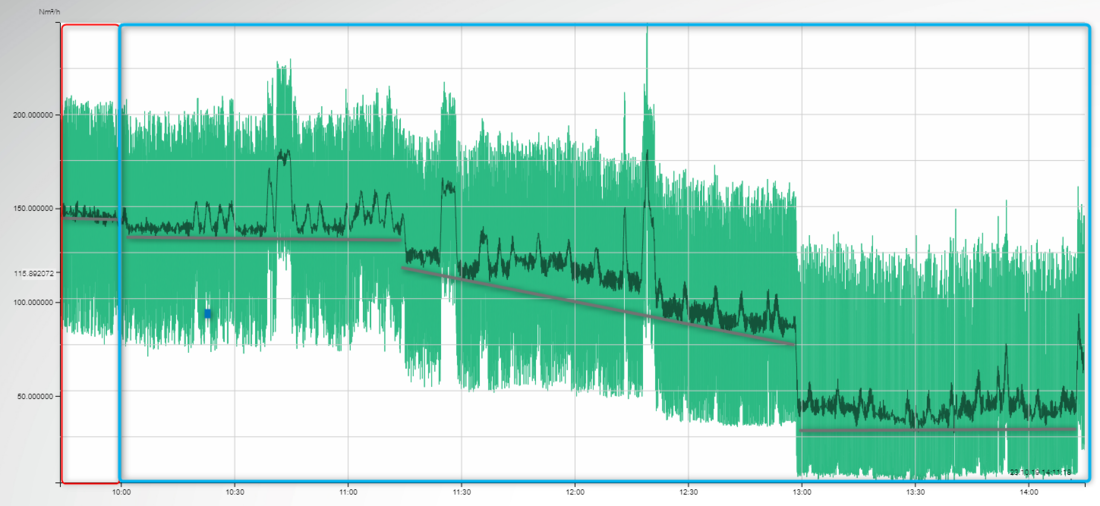
The following findings can be derived from this:
- Although there was no production before 10:00 am, the compressor delivers a lot of compressed air.
- The "production peaks" are very small compared to the base load
This indicates a very high leakage rate. To confirm the assumption, the ball valves to the machines were closed in the shutdown area in hall 1, so that their leakages are no longer supplied with compressed air.
The volume flow profile shows that the base load can be reduced enormously from closed ball valve to closed ball valve, thus demonstrating the influence of leakage elimination on the compressed air profile.
- Volume flow at the beginning: 88,28 cfm
- Volume flow after closing the ball valves: approx. 23,54 cfm
When the equipment in Hall 1 is operated again, the ball valves must be opened and thus compressed air escapes again via the leakages on and in the machines.
Recommended procedure for reduction of compressed air leakage rate
The process described here should be carried out cyclically in the company in order to keep the leakage rate as low as possible in the long term. The aim of the measures should be to achieve a permanent leakage rate of 5-10%, as experience has shown that a one-off search and rectification does not permanently reduce the leakage rate and new leaks will naturally occur again afterwards.


